VDMIS Smart Report has introduced completely a new way of creating, analyzing and sharing the inspection report that increase by several folds the efficiency, productivity and the understating of the inspection result generated by the CMM software.
Here's a breakdown of its functionality:
Separation of Inspection and Reporting: VDMIS allows the CMM programmer to focus solely on part programming and inspection without worrying about the report generation during that stage. Once the programming is complete, they can shift their attention to producing the report.
Customizable Reports: The CMM programmer can configure the report with custom nominal and tolerance values, selecting the features and dimensions to output. This allows for targeted reporting on specific aspects of the inspection.
Graphical and Analytical Reporting: The report can include graphical representations of the data for better visualization, and advanced Statistical Process Control (SPC) analysis to evaluate quality and performance trends over time.
Out-of-Tolerance Filtering: VDMIS Smart Report helps identify out-of-tolerance features, making it easier for users to pinpoint issues and take corrective action.
Enhanced Sharing and Collaboration: The streamlined sharing and collaboration features mean inspection results can be communicated more effectively across teams.
VDMIS Smart Report
The VDMIS Graphical Report brings together power, efficiency, and ease of use in a streamlined process that makes generating comprehensive graphical reports intuitive and fast. Here's what stands out about this feature:
Effortless Creation: Users can simply highlight the features they wish to include in the report and drop them into the graphical area. The process is quick, minimizing the time needed to organize or position elements manually.
Automatic Organization: Once features are added to the graphical report, VDMIS automatically arranges the balloons that display information about those features. It intelligently avoids overlapping leader lines, ensuring clarity and readability without the need for manual adjustments.
Color-Coded Balloons: The balloons are color-coded to provide instant feedback on the status of each feature. This visual coding clearly indicates whether a feature is within tolerance or out of tolerance, enhancing quick decision-making and report interpretation.
Simplicity with Impact: This tool combines the ease of drag-and-drop functionality with powerful automatic formatting, making it an essential feature for those who need to create detailed and readable inspection reports with minimal effort.
In essence, the VDMIS graphical reporting tool offers an efficient, user-friendly experience that enhances productivity without sacrificing accuracy or professionalism.
Blue-Print Report
The VDMIS Blue-Print Report in both 2D and 3D provides a brilliant and seamless representation of Geometric Dimensioning and Tolerancing (GD&T). It allows users to effortlessly generate comprehensive reports that integrate all dimensions and tolerances calculated in VDMIS, presented in an intuitive blueprint format. Here's what makes it powerful:
One-Step Conversion:All calculated dimensions and tolerances can be instantly converted into a Blue-print Report through a simple drag-and-drop action. This reduces the complexity and time required to generate detailed reports.
2D and 3D Blue-print Reports:The flexibility to create both 2D and 3D blueprint reports ensures that users can visualize and analyze data in whichever format suits their needs best. The 2D report provides a traditional view of the part's features, while the 3D report offers a more dynamic and interactive representation, enhancing the understanding of GD&T.
Live Report Integration:With just one click, both graphical and blueprint reports can be sent to VDMIS Live Report, streamlining the sharing and review process. This enables real-time collaboration and inspection analysis, improving workflow efficiency and team communication.
The VDMIS Blue-Print Report functionality is designed to offer a highly efficient and visually rich method for generating and sharing GD&T data, combining simplicity with advanced reporting capabilities.
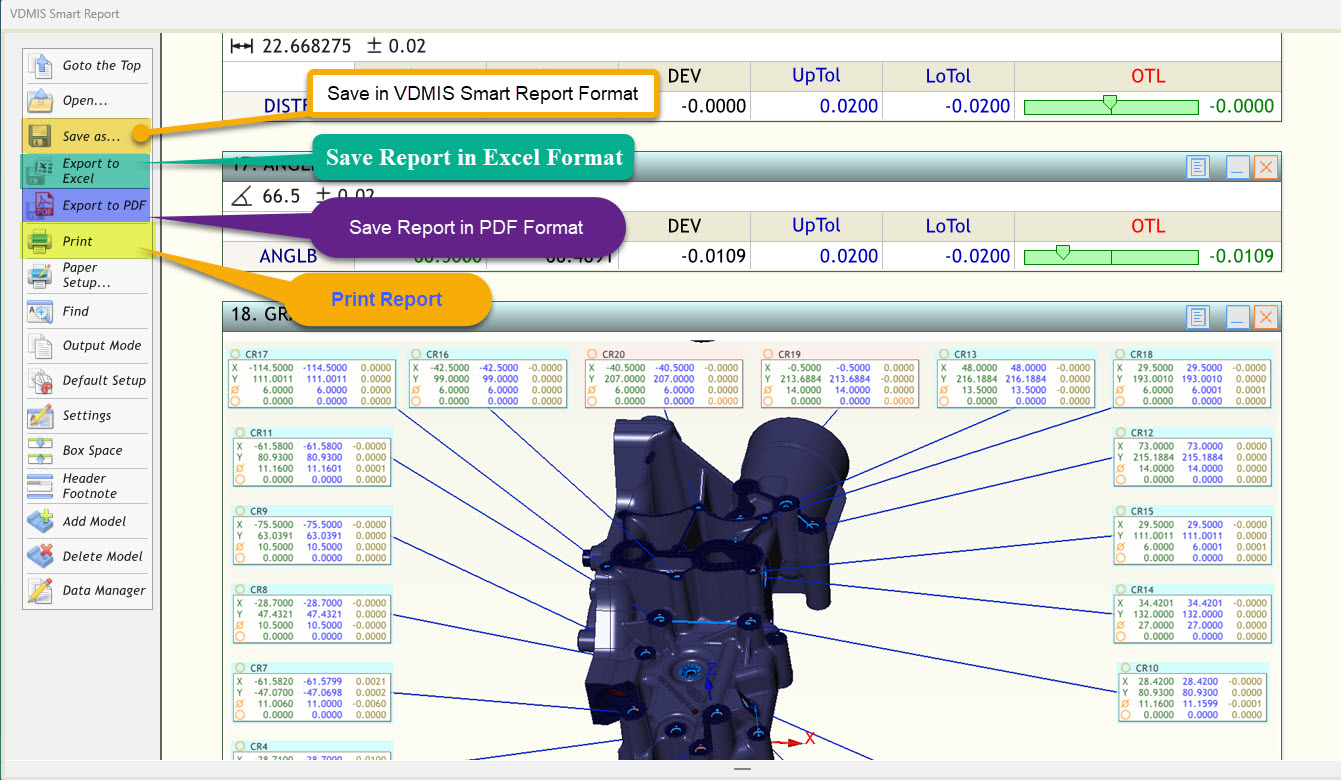
Report Saving Formats
Inspection Report could be Saved in the following Formats: